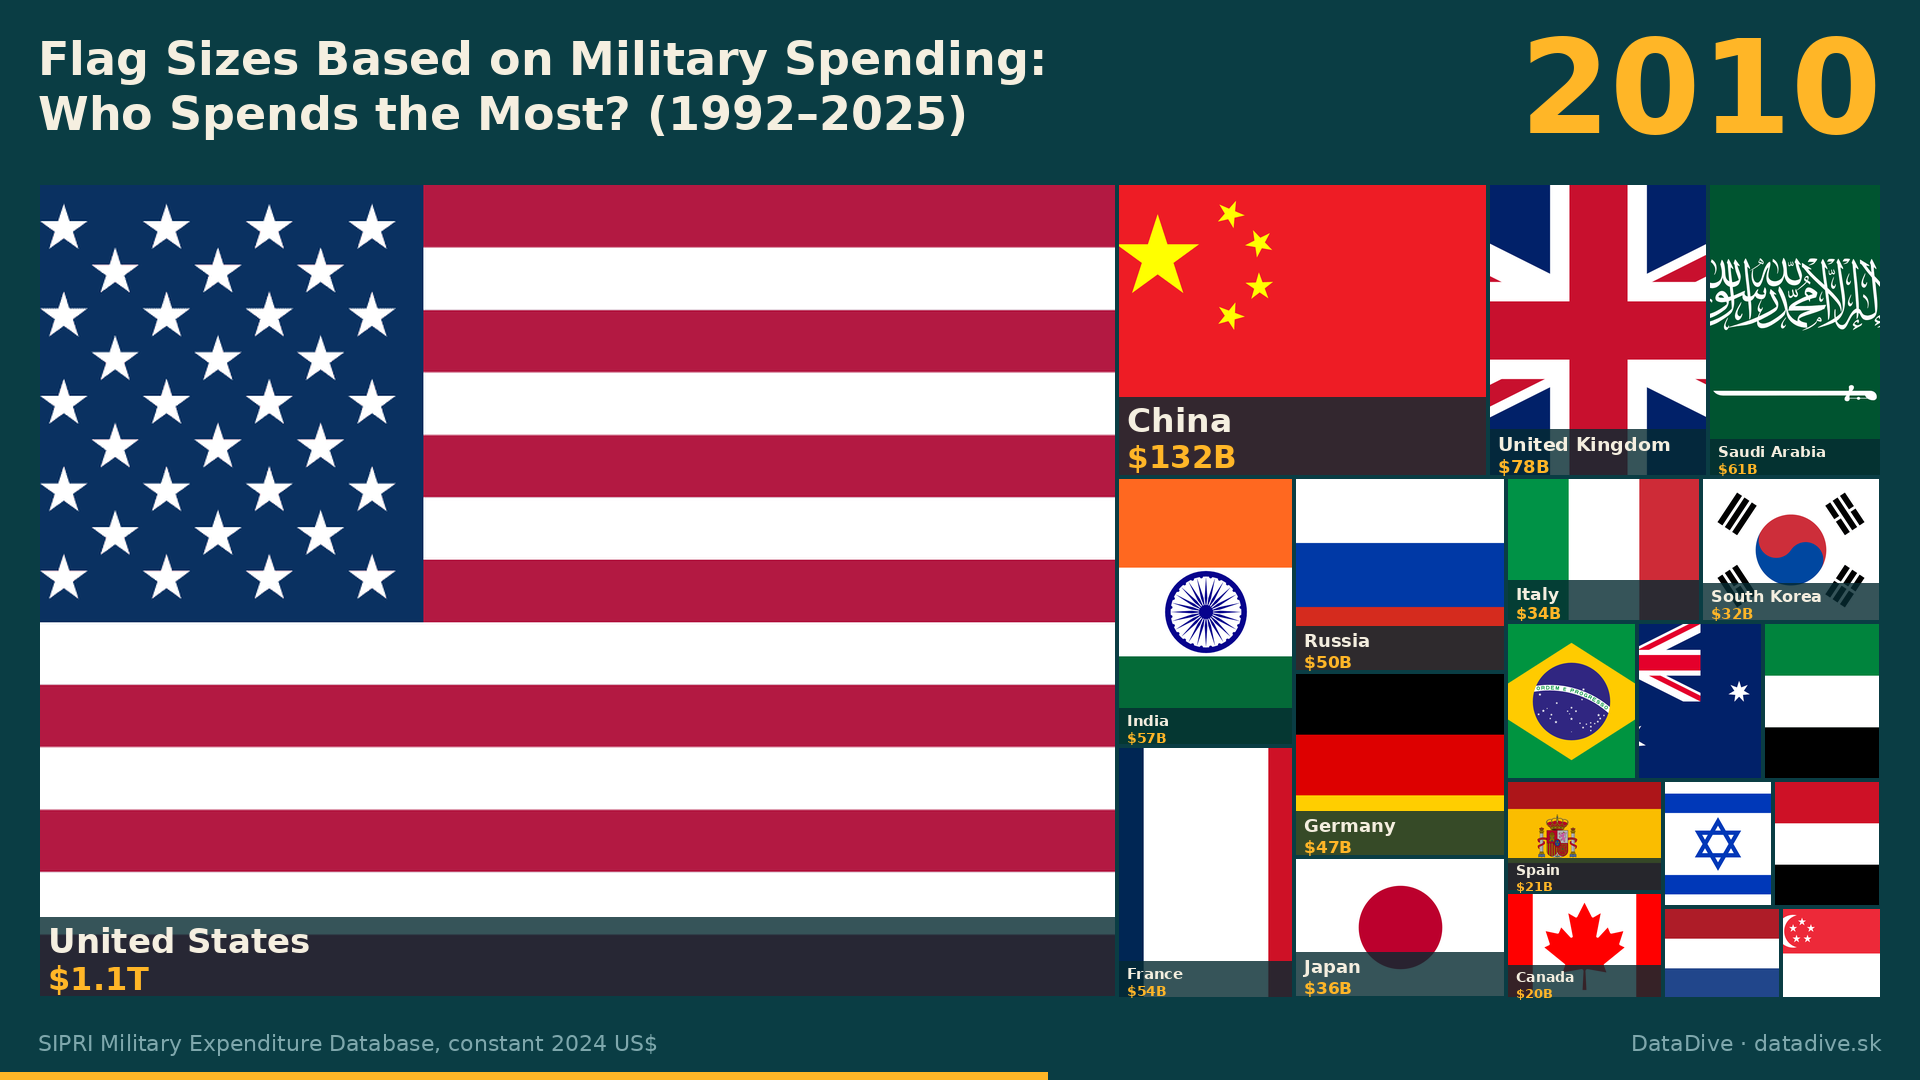
In 1992 the United States spent $726.6bn on its military, China $28.0bn. In 2025 the US spent $929.2bn and China $335.0bn. The gap between them shrank from 26 times to 2.8 times. This is the picture the SIPRI Military Expenditure Database gives for 1992–2025, in constant 2024 US dollars.
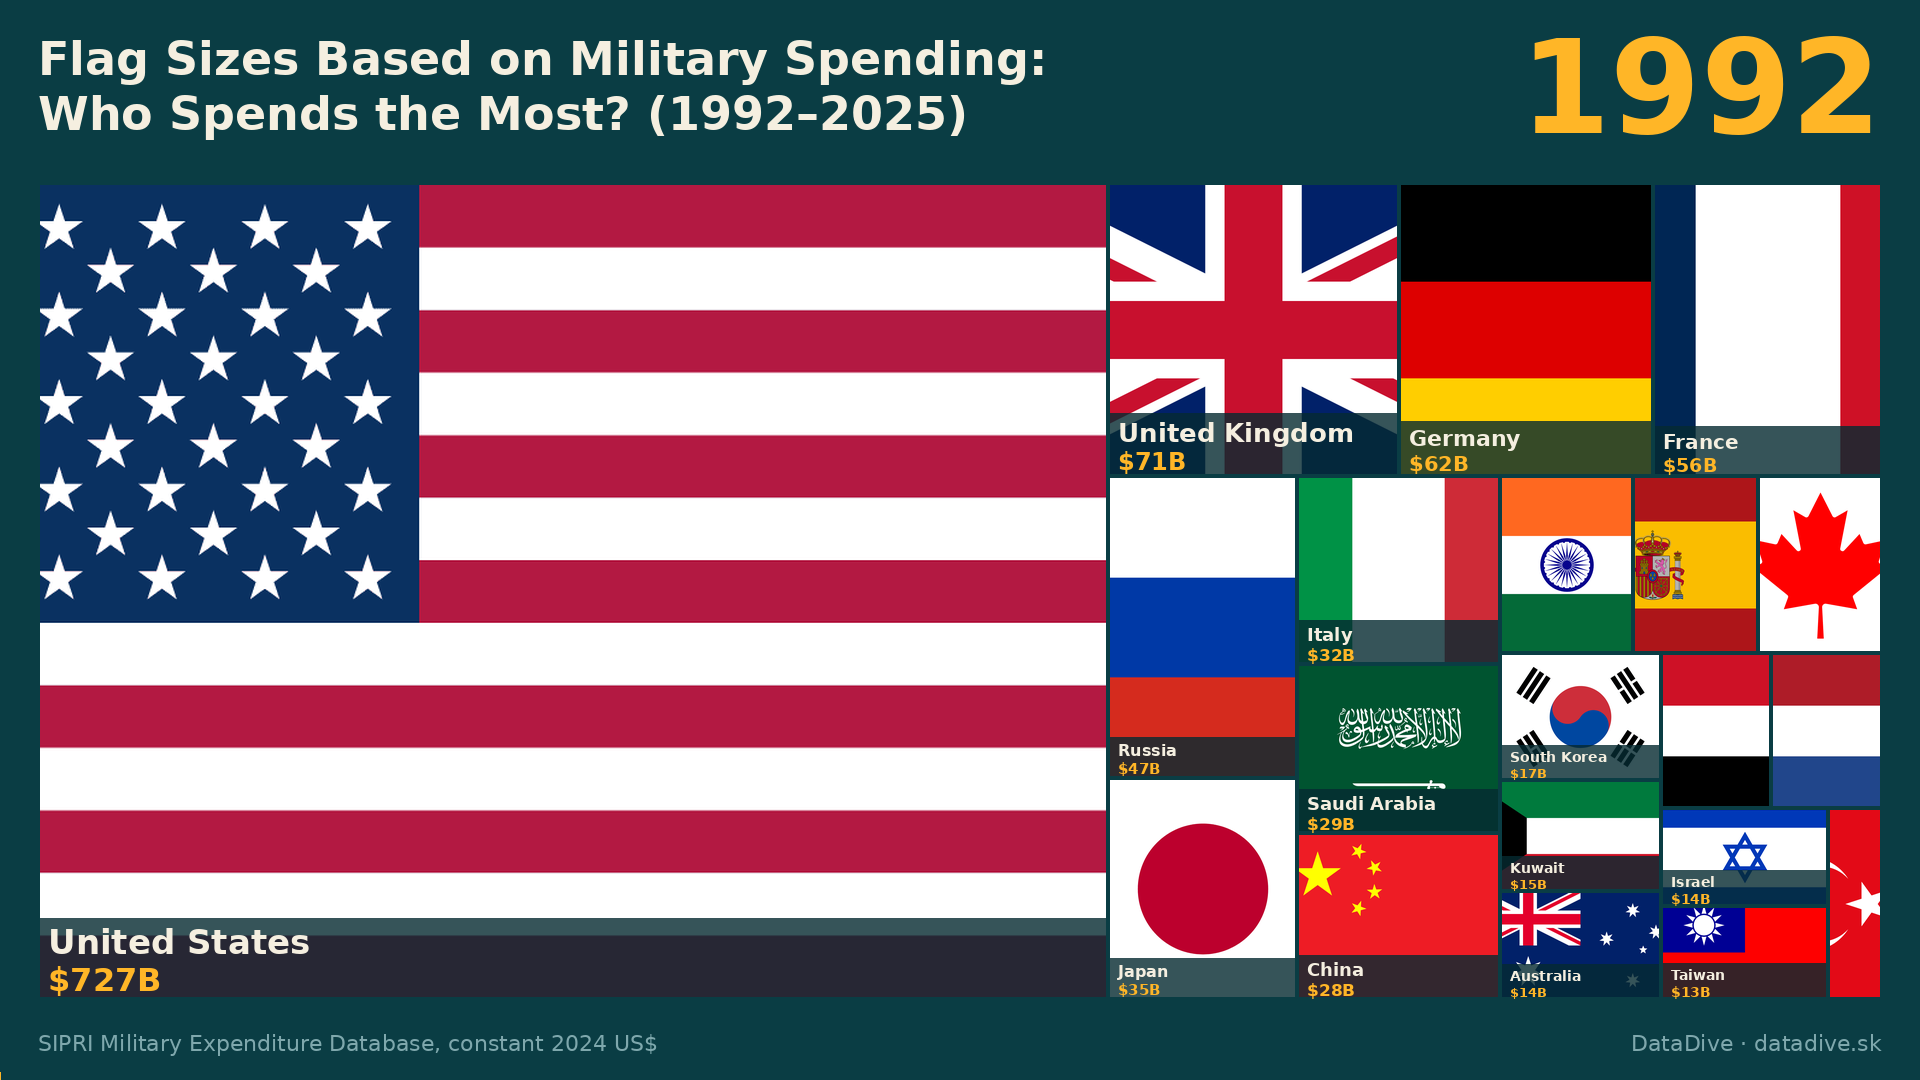
Who spent what
| Rank | 1992 | 2010 | 2025 |
|---|---|---|---|
| 1 | United States $726.6bn | United States $1,061.7bn | United States $929.2bn |
| 2 | United Kingdom $71.0bn | China $131.5bn | China $335.0bn |
| 3 | Germany $62.2bn | United Kingdom $78.0bn | Russia $158.2bn |
| 4 | France $55.7bn | Saudi Arabia $61.4bn | Germany $106.7bn |
| 5 | Russia $47.5bn | India $57.3bn | India $93.3bn |
The US-to-China ratio was 26.0 in 1992, 13.9 in 2000, 8.1 in 2010, 3.7 in 2020 and 2.8 in 2025.
Europe and the war in Ukraine
Ukraine's spending went from $6.7bn in 2021 to $40.2bn in 2022 and $77.6bn in 2025. Germany's rose from $59.9bn in 2021 to $106.7bn in 2025, and Russia's from $68.5bn to $158.2bn over the same period.

How to read the numbers
- Figures are in constant 2024 US dollars (SIPRI). They are corrected for inflation and converted at 2024 exchange rates, so years can be compared.
- SIPRI figures for China and Russia are estimates; they are not official national numbers.
- The series starts in 1992 because earlier years require handling the Soviet Union and a divided Germany separately.
- The 2025 US value is lower than 2024 ($1,004.9bn) in this edition of the dataset.
- The chart shows the 20 largest spenders in each year. Flag area is proportional to spending.
Sources
SIPRI Military Expenditure Database, sipri.org/databases/milex, © SIPRI 2026 (data for 1949–2025, constant 2024 US$).