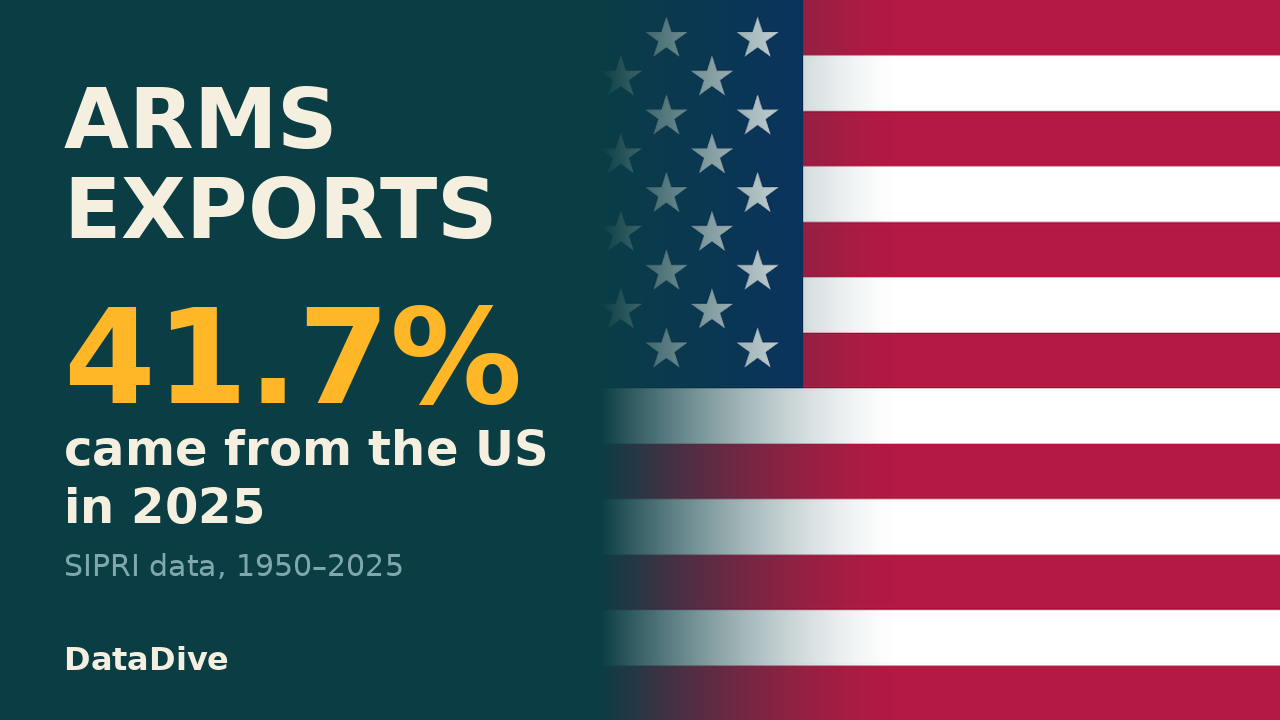
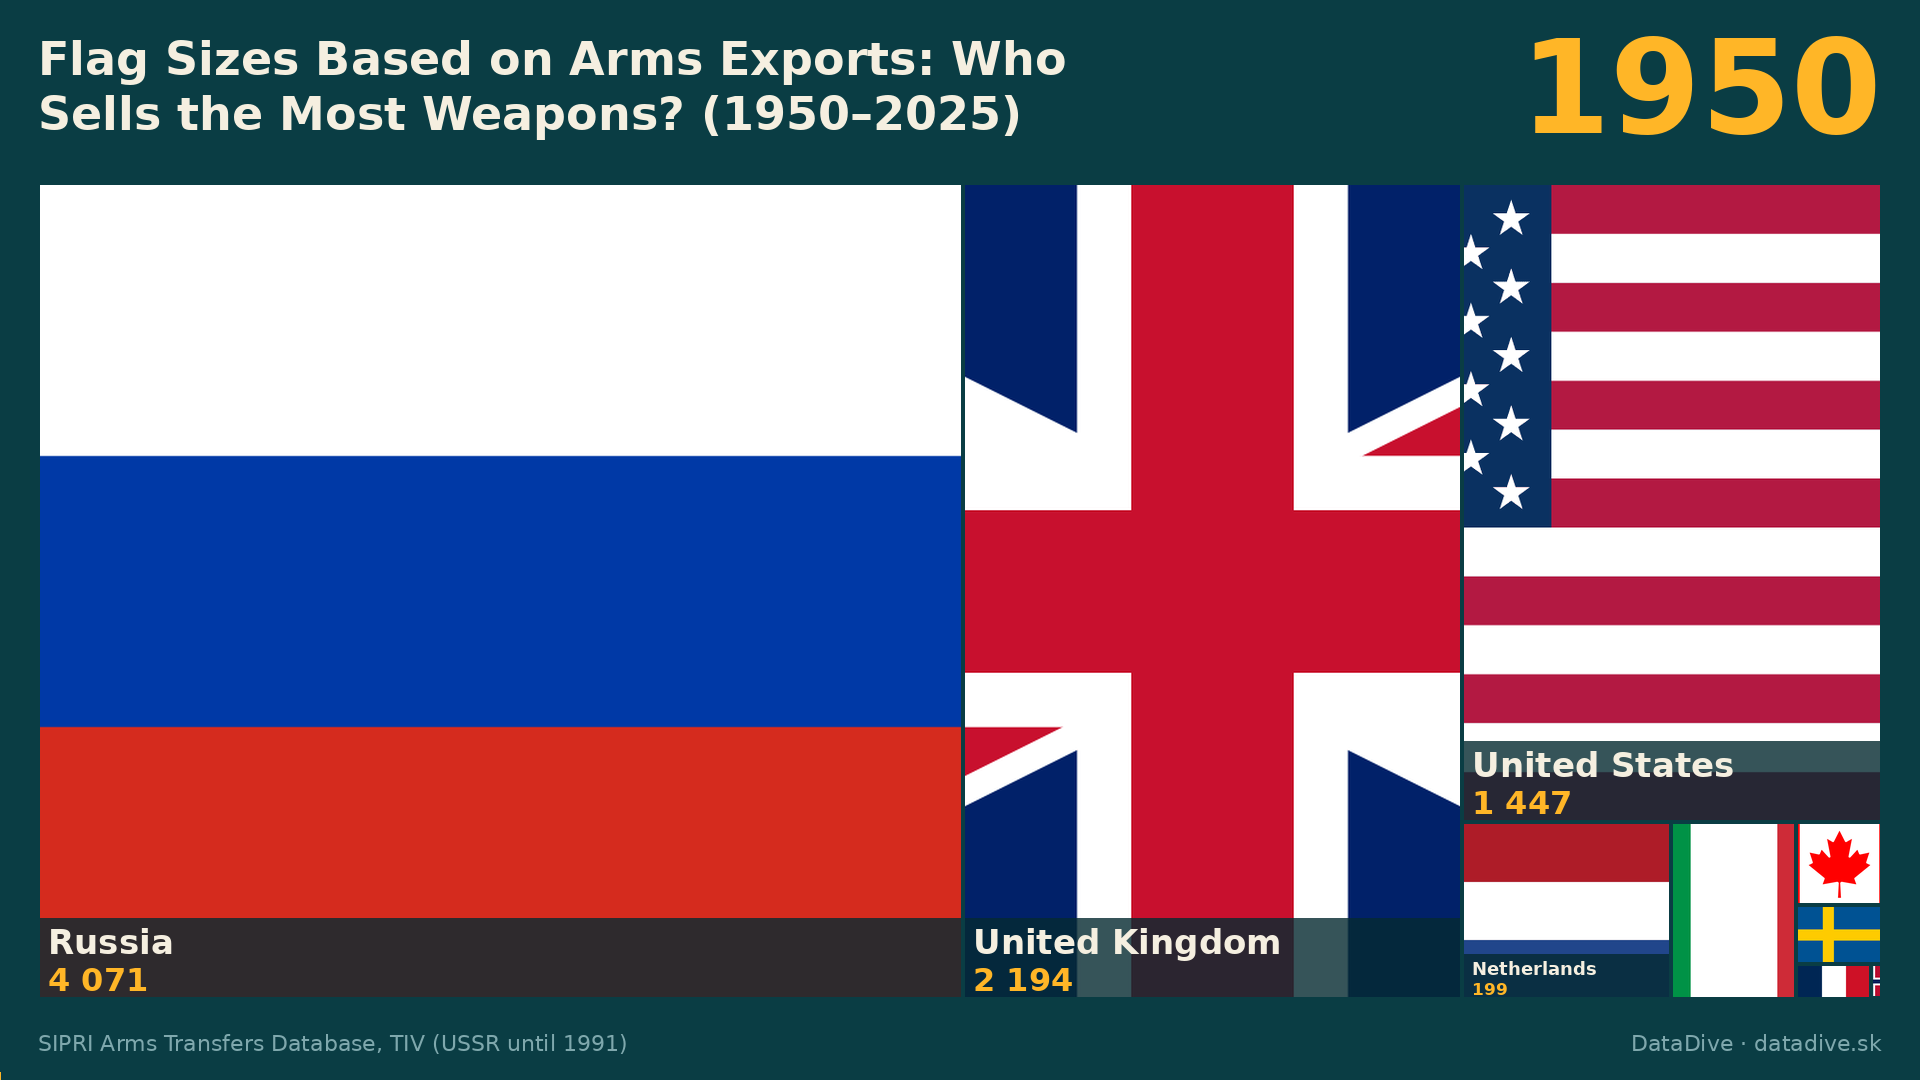
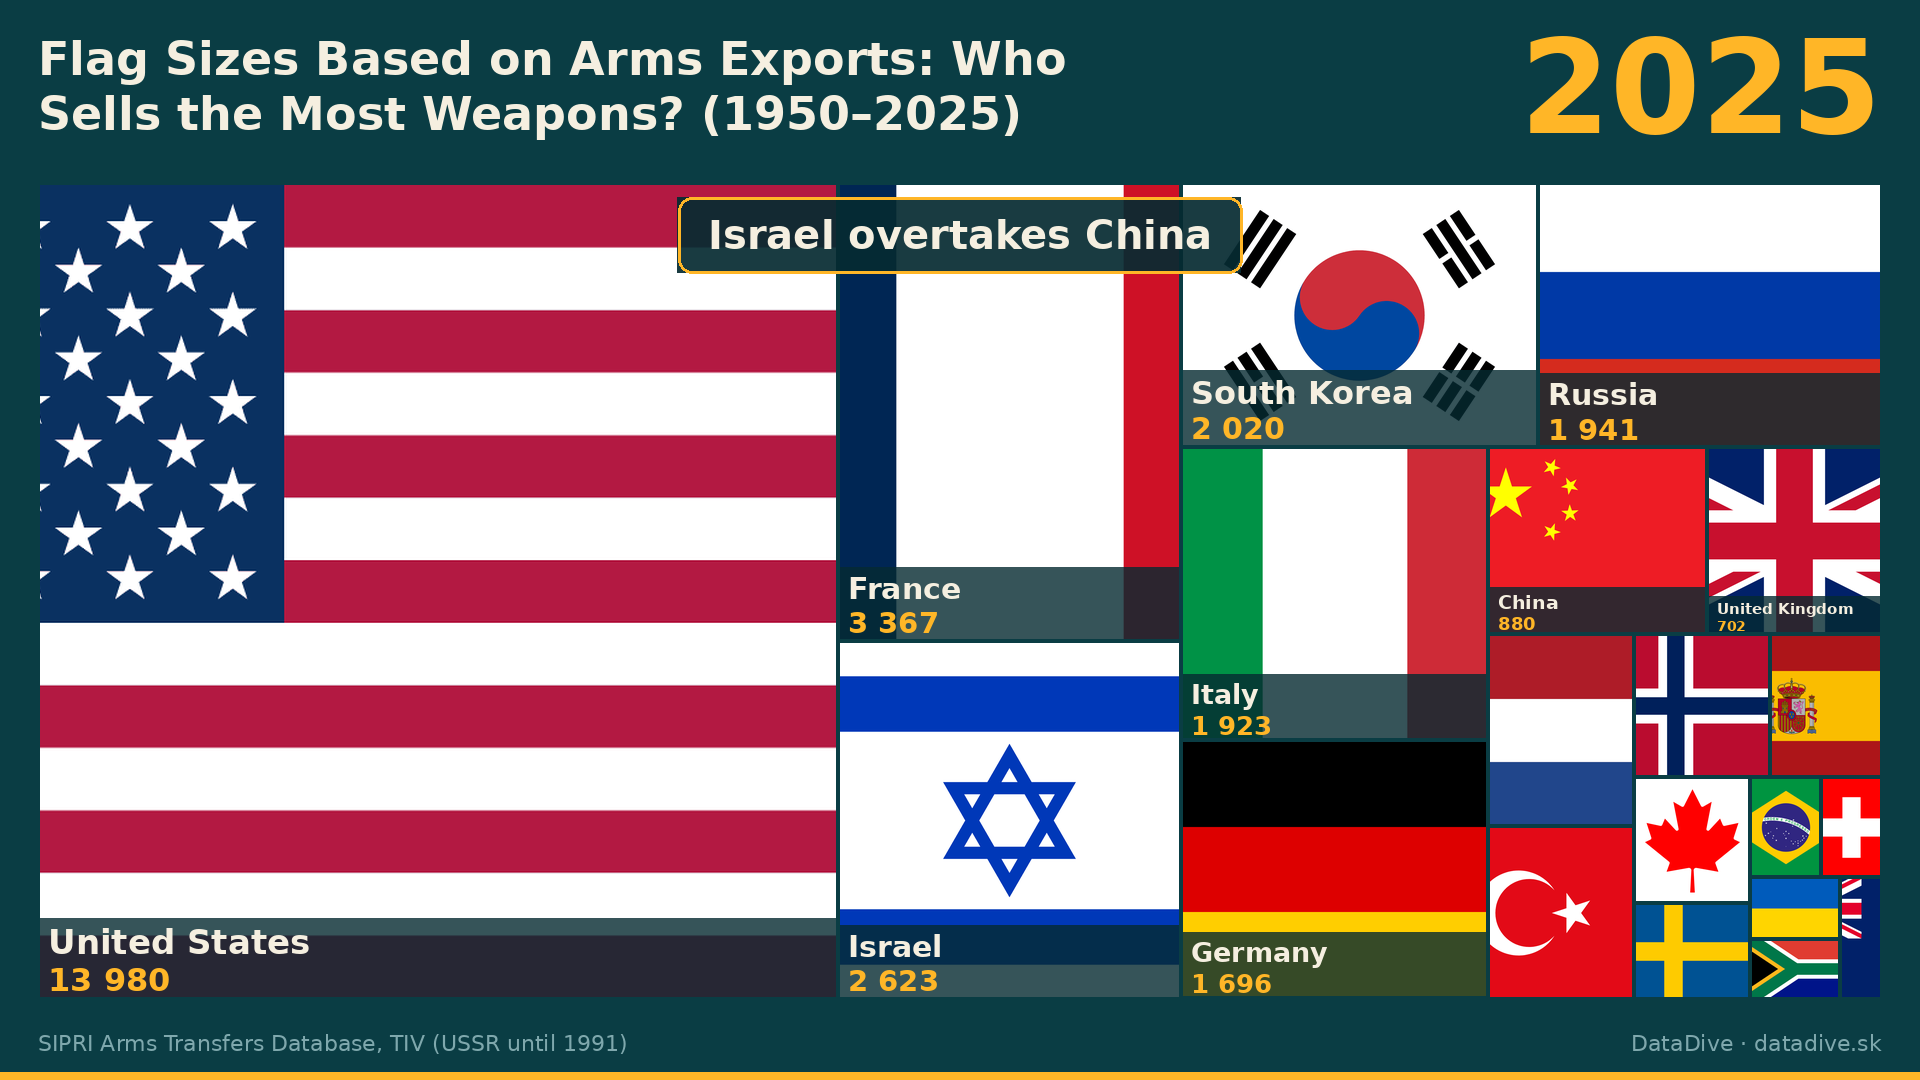
In 2025 the United States delivered 13,980 million SIPRI trend-indicator values (TIV) of major weapons, 41.7% of the world total of 33,535. France was second with 3,367, Israel third with 2,623, South Korea fourth with 2,020 and Russia fifth with 1,941. Seventy-five years earlier the order was different: in 1950 the Soviet Union led with 4,071, ahead of the United Kingdom (2,194) and the United States (1,447).
Two superpowers
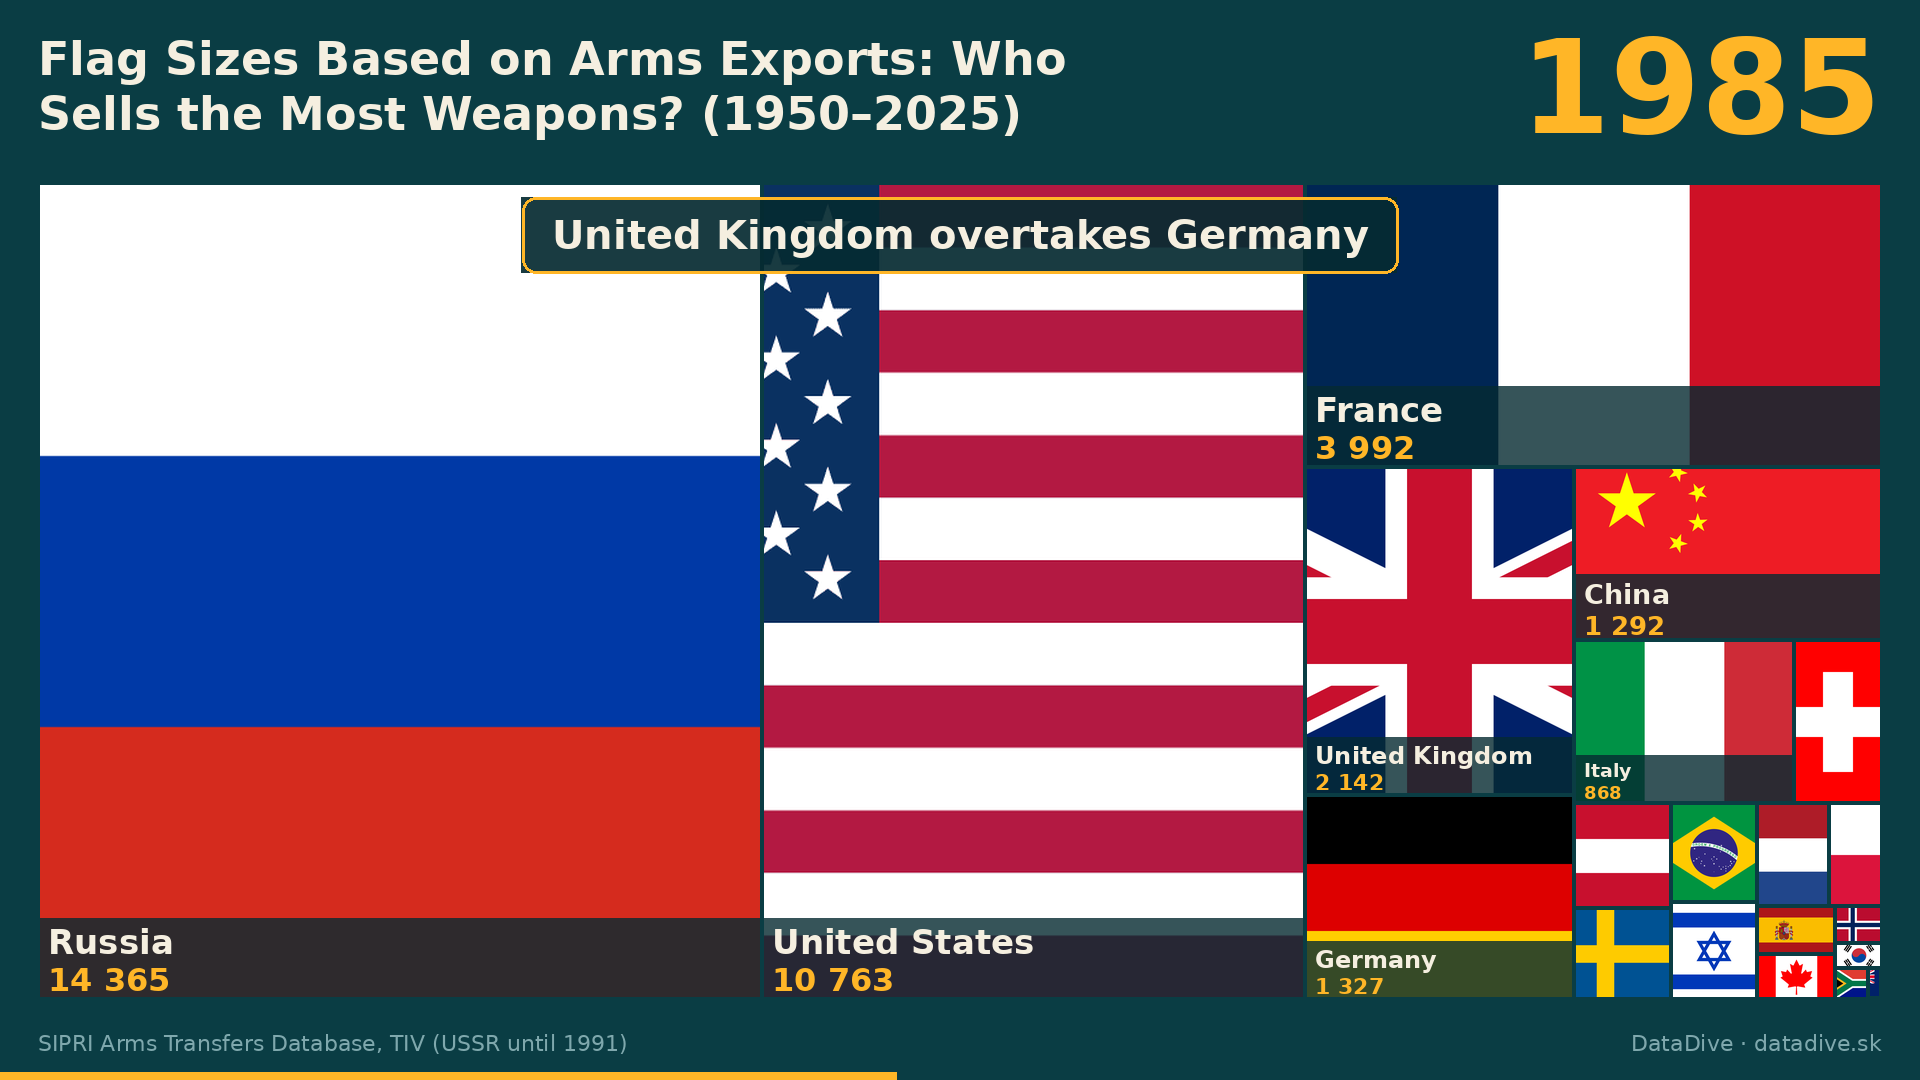
The US and the Soviet Union traded the lead for four decades. In 1975 the US was ahead with 15,342 against 11,742 for the Soviet Union; in 1985 the Soviet Union led with 14,365 against 10,763. In 1990 the US was ahead again, 10,704 to 9,864.
After 1991
Russia's exports were 2,643 in 1992, against 9,864 for the Soviet Union in 1990. Russia's volume was 3,660 in 2020 and 1,941 in 2025, while France rose from 2,290 to 3,367 over the same years.
What TIV means
- TIV is not money. SIPRI's trend-indicator value is based on the known unit production costs of a core set of weapons and measures the transfer of military resources, not the sale price. SIPRI says TIV figures should not be compared with GDP, military spending or financial values of arms deals.
- The data cover major conventional weapons (aircraft, armoured vehicles, ships, missiles, air defence, sensors and others), not small arms or ammunition.
- The Soviet Union (until 1991) and Russia (from 1992) are shown here as one flag. Germany before 1990 is West Germany. Only the 25 largest exporters are in the chart; the world total is SIPRI's.
Sources
SIPRI Arms Transfers Database, sipri.org/databases/armstransfers, © SIPRI. Method: sources and methods.