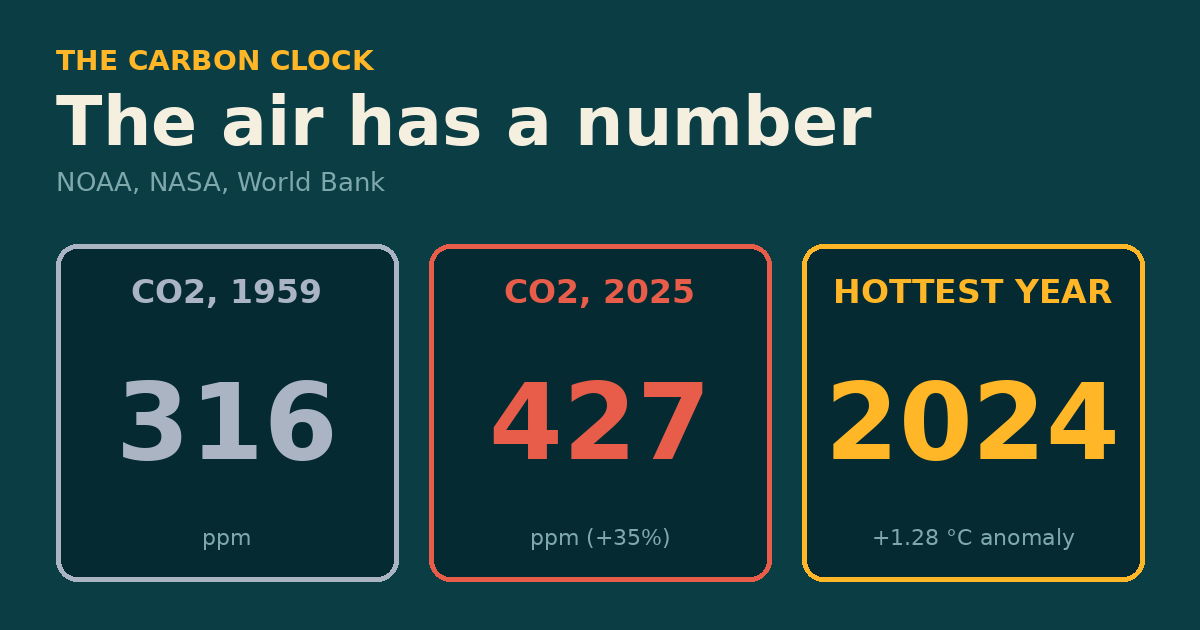
On a volcano in Hawaii, a station has measured the carbon dioxide in the air since 1958. In 2025 the annual mean was 427.4 parts per million (ppm), against 316.0 in 1959, an increase of 111 ppm or 35%. NASA's temperature record shows the same decades getting hotter: the three hottest years in its record are the three most recent ones. This article follows the numbers behind the video: the CO2 curve, the temperature curve, energy, coal, nuclear and hydro power, emissions per person and in total, and forests.
How to read the numbers
CO2 is shown in parts per million: out of every million molecules of air, about 427 are carbon dioxide. Mauna Loa is one station, not a global average, but it tracks the global trend closely. Temperature is a anomaly, the difference from the 1951 to 1980 average of NASA GISS, not a thermometer reading and not measured against the pre-industrial period. Several other series are modeled estimates that are revised every year.
1. The Keeling curve
The annual mean rose every year of the record: 316.0 ppm in 1959, 354.4 in 1990, 369.7 in 2000, 390.1 in 2010, 424.6 in 2024 and 427.4 in 2025. The monthly value for September 2026 was 426.07 ppm and for August 427.55. Within each year the value wiggles with the northern growing season.

The rise is also speeding up. The concentration rose by 9 ppm in the 1960s, 13 in the 1970s, 16 in the 1980s, 15 in the 1990s, 20 in the 2000s and 24 in the 2010s. The single year 2025 added 2.74 ppm.

| Year | Annual mean CO2 (ppm) |
|---|---|
| 1959 | 316.0 |
| 1970 | 325.7 |
| 1980 | 338.8 |
| 1990 | 354.4 |
| 2000 | 369.7 |
| 2010 | 390.1 |
| 2020 | 414.2 |
| 2025 | 427.4 |
Source: NOAA Global Monitoring Laboratory, co2_annmean_mlo.txt (public domain).
2. The heat
NASA's global land-ocean temperature anomaly was -0.17 °C in 1880 and -0.17 in 1950, then rose to 0.39 in 2000, 1.01 in 2016 and 1.28 in 2024, the highest of the record. 2025 (1.18) was second and 2023 (1.17) third. The first nine months of 2026 range from 1.08 to 1.42; October onward is not yet published.

| Year | Anomaly vs 1951 to 1980 (°C) |
|---|---|
| 1880 | -0.17 |
| 1950 | -0.17 |
| 1980 | +0.26 |
| 2000 | +0.39 |
| 2016 | +1.01 |
| 2020 | +1.01 |
| 2023 | +1.17 |
| 2024 | +1.28 |
| 2025 | +1.18 |
Source: NASA GISS Surface Temperature Analysis v4, GLB.Ts+dSST.csv (public domain).
The two curves rise together: CO2 up 111 ppm from 1959 to 2025, the temperature anomaly up 1.45 °C from 1950 to 2024. The physics that links CO2 to heat is established climate science, summarized by the Intergovernmental Panel on Climate Change. These two charts only show measurements; they do not prove the cause by themselves.
3. Energy per person
An American used about 7,669 kg of oil equivalent in 1990 and 6,454 in 2024. A German fell from 4,422 to 2,874. China rose from 773 to 2,947, India from 324 to 777. Nigeria stayed near 317. Energy use is not the same as emissions: the same energy can come from coal, gas, nuclear, water or wind.

| Country | 1990 | 2024 |
|---|---|---|
| United States | 7,669 | 6,454 |
| Japan | 3,538 | 3,004 |
| Germany | 4,422 | 2,874 |
| China | 773 | 2,947 |
| Brazil | 942 | 1,528 |
| India | 324 | 777 |
| Nigeria | 287 | 317 |
World Bank EG.USE.PCAP.KG.OE, kg of oil equivalent per person.
4. Coal in electricity
Coal made 71% of China's electricity in 1990 and 59% in 2024. In India the share went from 65% to 72%. In the United States it fell from 53% to 16% and in Germany from 58% to 22%.

| Country | 1990 | 2024 |
|---|---|---|
| China | 71.0% | 58.6% |
| India | 65.3% | 72.3% |
| United States | 52.8% | 15.7% |
| Germany | 58.5% | 22.4% |
World Bank EG.ELC.COAL.ZS.
5. Nuclear and hydro
France makes 67% of its electricity from nuclear plants; Russia and the United States about 17%; Japan 10%; China 4%; India 3%. Canada makes 54% of its electricity from hydropower and Brazil 52%; China 14%, the United States 6%, Germany 5% and the United Kingdom 2%. Latest available year (2024 or 2025).

World Bank EG.ELC.NUCL.ZS and EG.ELC.HYRO.ZS.
6. Who emits
Per person in 2024, a Russian emitted 14.0 tonnes of CO2, an American 13.6, a Chinese 9.3, a Japanese 7.8, a German 6.9. The world average was 4.7; Indonesia 2.9, Brazil 2.3, India 2.2 and Nigeria 0.6. Multiplying by population gives rough national totals (our calculation, excluding land use): China about 13.1 billion tonnes (34% of the world), the United States 4.6 (12%) and India 3.2 (8%). A total says how much a country adds to the air; a per-person figure says what an average resident adds.

| Country | t CO2 per person, 2024 |
|---|---|
| Russia | 14.0 |
| United States | 13.6 |
| China | 9.3 |
| Japan | 7.8 |
| Germany | 6.9 |
| World | 4.7 |
| Indonesia | 2.9 |
| Brazil | 2.3 |
| India | 2.2 |
| Nigeria | 0.6 |
World Bank EN.GHG.CO2.PC.CE.AR5 (EDGAR, European Commission JRC), carbon dioxide excluding land use.
7. Forests
Forest covers 68% of Japan, 59% of Brazil, 51% of Russia, 51% of Indonesia, 42% of Canada, 34% of the United States, and 24% of China and of India. The FAO definition counts plantations as forest and says nothing about age or health. A forest stores carbon, but fires, logging and drought can release it.

| Country | Forest area, % of land, 2024 |
|---|---|
| Japan | 68.3% |
| Brazil | 58.5% |
| Russia | 50.8% |
| Indonesia | 50.7% |
| Canada | 42.0% |
| United States | 33.8% |
| Germany | 32.8% |
| China | 24.0% |
| India | 24.4% |
| United Kingdom | 13.5% |
World Bank AG.LND.FRST.ZS (FAO).
What the data cannot tell us
The numbers show what changed, not who should do what. Mauna Loa is one station. Temperature anomalies are relative to 1951 to 1980. Emissions per person and in total are modeled estimates that exclude land use and historical (cumulative) emissions, and the national totals here are our own multiplication. Responsibility depends on history, trade and choices that these charts do not capture.
Method and sources
CO2: NOAA Global Monitoring Laboratory, Mauna Loa annual and monthly means. Temperature: NASA GISS Surface Temperature Analysis v4. Everything else: World Bank Open Data API (CC BY 4.0), indicators EG.USE.PCAP.KG.OE, EG.ELC.COAL.ZS, EG.ELC.NUCL.ZS, EG.ELC.HYRO.ZS, EN.GHG.CO2.PC.CE.AR5, AG.LND.FRST.ZS and SP.POP.TOTL. Retrieved 1 November 2026. Derived figures (decade changes, national totals, percent changes) are our calculations.