
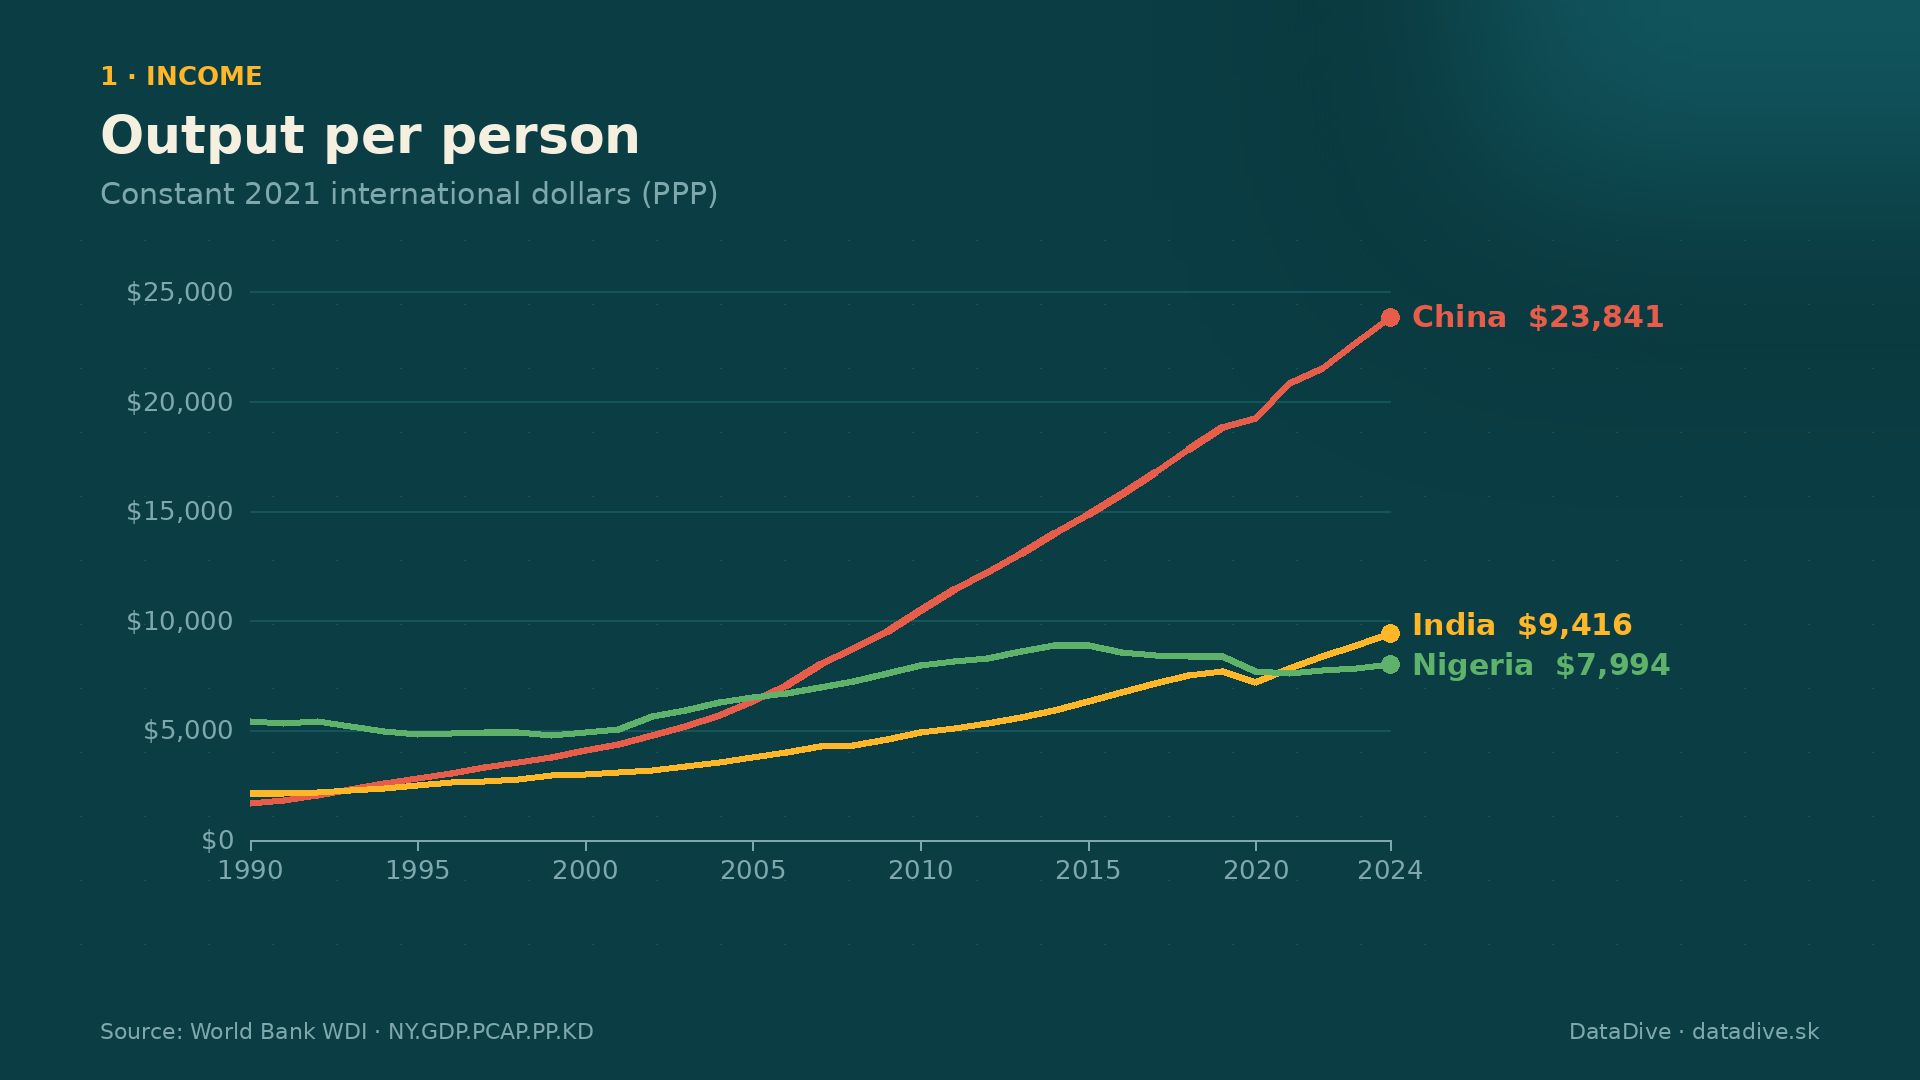
In 1990, Nigeria was the richest of three countries that today hold more than a third of humanity. Measured per person, in constant 2021 international dollars, it produced about $5,424 a year, against $2,140 in India and $1,667 in China. By 2024 the order was reversed: $23,841 in China, $9,416 in India and $7,994 in Nigeria.
This article follows that gap through eleven measures from the World Bank's World Development Indicators: income, jobs, cities, energy, crops, factories, investment, electricity, health, air and people. It states what the data shows and, just as importantly, where it cannot tell us why. The video covers the same charts in about ten minutes.
How to read the numbers
Income is GDP per person at purchasing power parity (PPP), in constant 2021 international dollars. PPP adjusts for the fact that prices differ between countries; constant dollars remove inflation, so 1990 and 2024 can be compared. It is a mean, not a median, so it says nothing about how evenly income is shared. Several series are modeled estimates (marked below) and the World Bank revises them every year.
1. Income: China passes India in 1993, Nigeria in 2006
China's income per person grew 14.3 times between 1990 and 2024. India's grew 4.4 times. Nigeria's grew only 1.47 times. For comparison, the United States grew 71% and Germany 48% over the same 34 years.
| Country | 1990 | 2000 | 2010 | 2024 | Change |
|---|---|---|---|---|---|
| China | 1,667 | 4,066 | 10,476 | 23,841 | ×14.3 |
| India | 2,140 | 3,010 | 4,914 | 9,416 | ×4.4 |
| Nigeria | 5,424 | 4,889 | 7,963 | 7,994 | ×1.5 |
| United States | 44,384 | 55,046 | 59,797 | 75,698 | ×1.7 |
| Germany | 42,355 | 49,956 | 54,826 | 62,655 | ×1.5 |
Indicator NY.GDP.PCAP.PP.KD, constant 2021 international dollars.
2. Jobs: fewer people on farms
In 1991, 60% of Chinese workers were employed in agriculture, against 63% in India and 54% in Nigeria. By 2024 the shares were 22%, 42% and 34%. In China the share fell by 37 percentage points. These are modeled ILO estimates, not a census.

| Country | 1991 | 2000 | 2010 | 2024 |
|---|---|---|---|---|
| China | 59.6% | 50.0% | 36.7% | 22.2% |
| India | 63.1% | 59.6% | 51.1% | 42.4% |
| Nigeria | 53.8% | 52.3% | 45.0% | 34.1% |
| United States | 2.9% | 2.4% | 1.9% | 1.6% |
Indicator SL.AGR.EMPL.ZS (ILO modeled estimate).
3. Cities: Nigeria urbanized without the income gain
China went from 26% urban to 66%. Nigeria went from 35% to 63%, almost as fast, yet its income per person barely moved. India is only 35% urban, despite more than fourfold income growth. The data cannot explain why, but it shows that moving to cities is not sufficient by itself.

| Country | 1990 | 2000 | 2010 | 2024 |
|---|---|---|---|---|
| China | 26.2% | 36.4% | 49.2% | 65.9% |
| India | 25.6% | 27.6% | 30.9% | 35.4% |
| Nigeria | 35.2% | 43.3% | 51.7% | 63.0% |
Indicator SP.URB.TOTL.IN.ZS.
4. Energy: China overtakes Germany per person
Energy use per person is not a goal in itself, but it tracks how much of daily life runs on machines, transport, heating and light. China rose from 773 to 2,947 kg of oil equivalent a year, now above Germany's 2,874. India went from 324 to 777. Nigeria stayed at about 317. In the United States (6,454) and Germany it has fallen since 2000.

| Country | 1990 | 2000 | 2010 | 2024 |
|---|---|---|---|---|
| China | 773 | 898 | 1,900 | 2,947 |
| India | 324 | 395 | 534 | 777 |
| Nigeria | 287 | 274 | 335 | 317 |
| United States | 7,669 | 8,055 | 7,163 | 6,454 |
| Germany | 4,422 | 4,094 | 4,030 | 2,874 |
Indicator EG.USE.PCAP.KG.OE, kg of oil equivalent per person.
5. Factories and 6. Crops
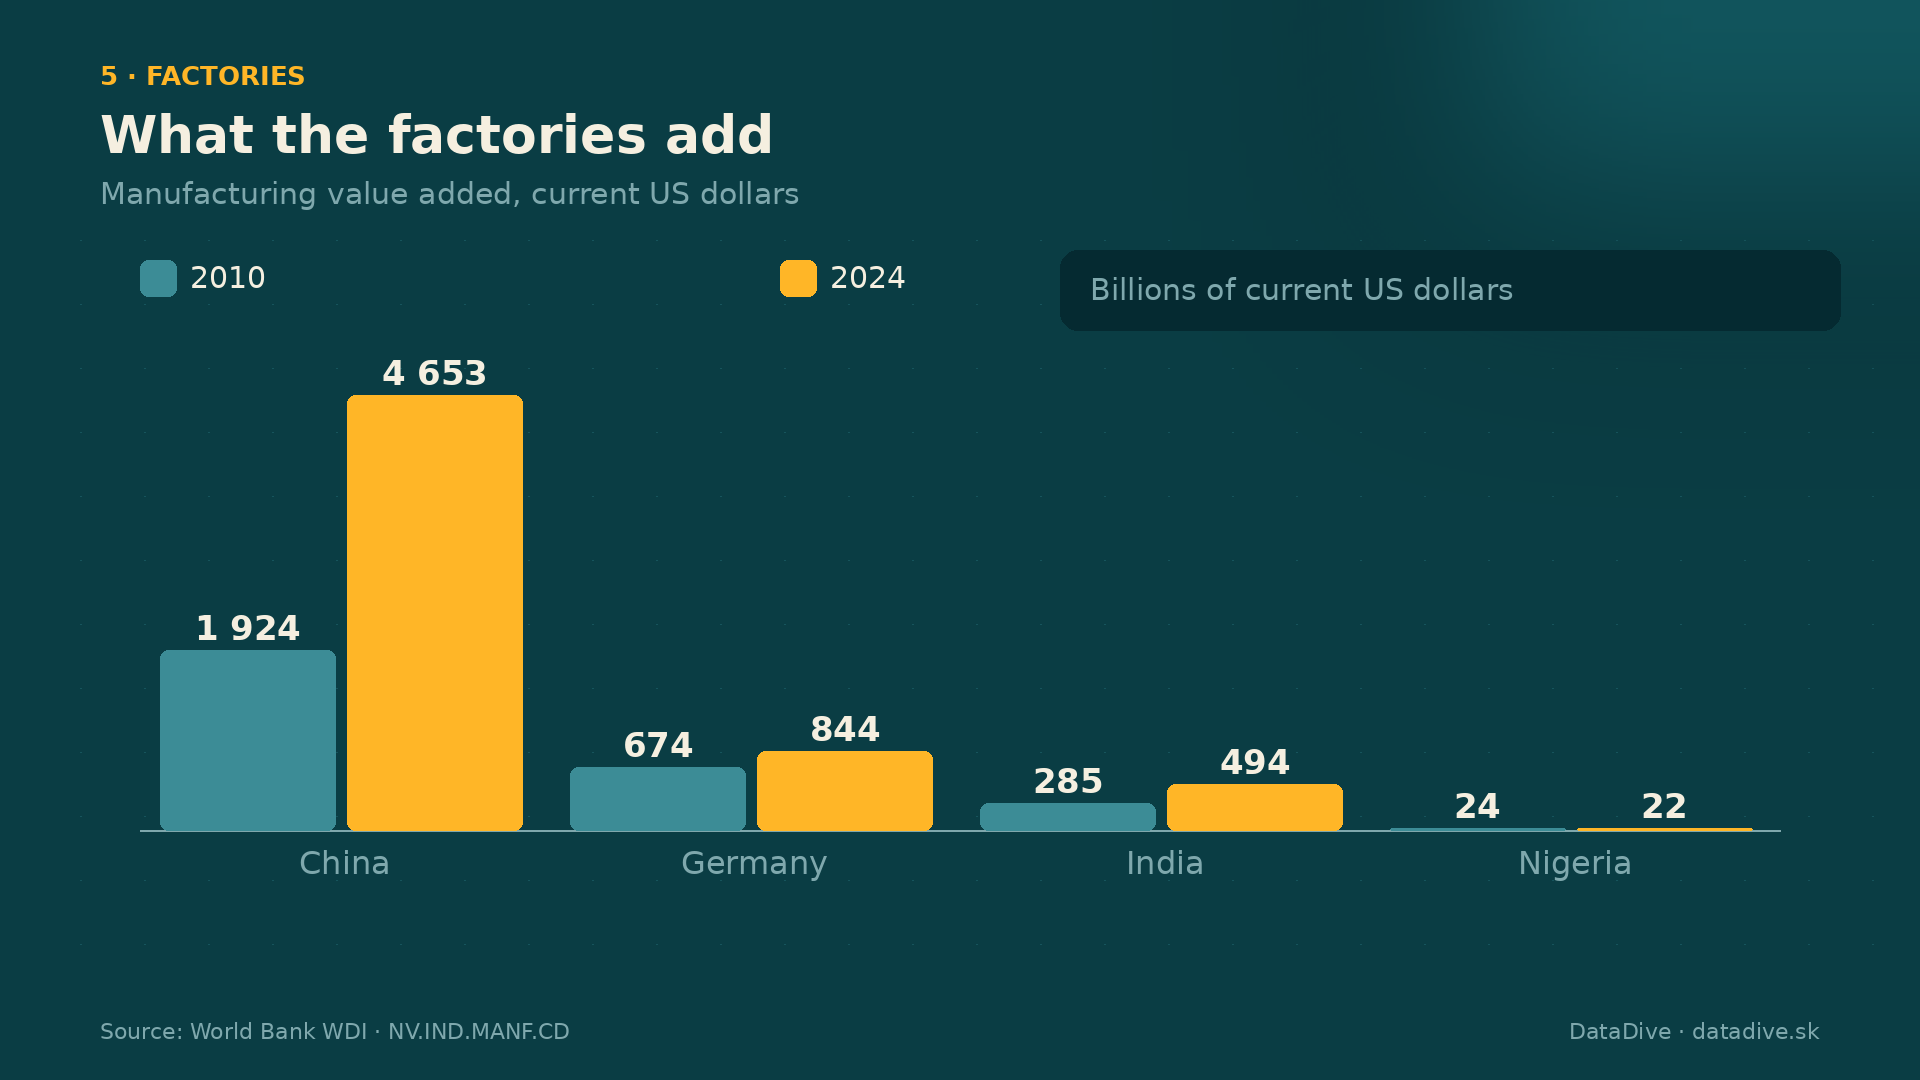
China's manufacturing value added rose from $1.9 trillion in 2010 to $4.7 trillion in 2024 (current US dollars). Germany went from $0.7 to $0.8 trillion, India from $0.3 to $0.5 trillion and Nigeria is at about $22 billion. The United States has no value after 2021 in this database, so it is left out. Cereal yields tell a similar story: China 4,306 to 6,424 kg per hectare, India 1,891 to 3,602, Nigeria 1,148 to 1,549.
| Country | Manufacturing 2010 | Manufacturing 2024 | Cereal yield 1990 | Cereal yield 2023 |
|---|---|---|---|---|
| China | $1,924B | $4,653B | 4,306 | 6,424 |
| Germany | $674B | $844B | 5,411 | 7,007 |
| India | $285B | $494B | 1,891 | 3,602 |
| Nigeria | $24B | $22B | 1,148 | 1,549 |
Indicators NV.IND.MANF.CD (current US dollars; exchange-rate effects apply) and AG.YLD.CREL.KG (kg per hectare; single years vary with weather).
7. Investment: how growth is paid for
China invested 34% of its output in 1990, 46% in 2010 and 40.5% in 2024, almost twice the United States' 21.5%. India rose from 27% to 34%. This database has no investment series for Nigeria.

Indicator NE.GDI.TOTL.ZS, gross capital formation as a percent of GDP.
8. Electricity and 9. Health
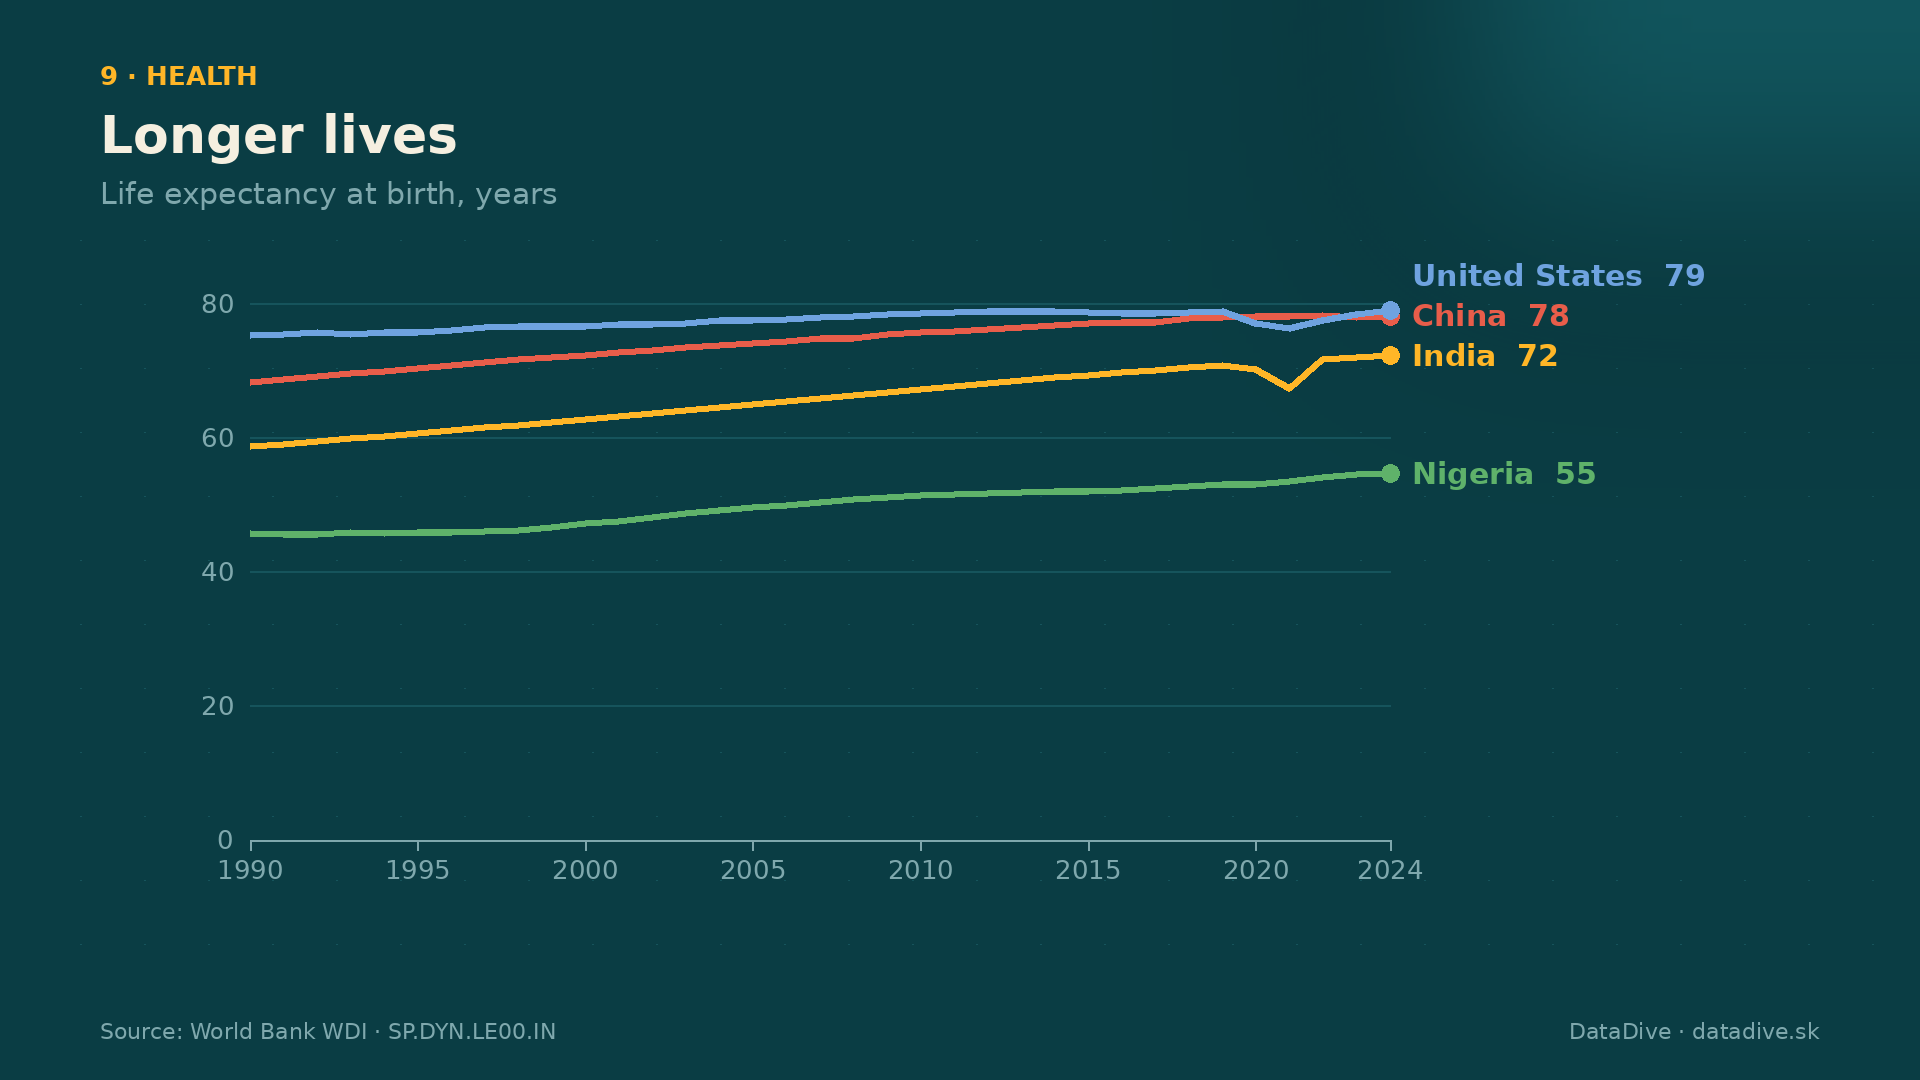
In 2000, 60% of Indians and 43% of Nigerians had access to electricity (China: 97%). By 2023, India was at 99.5% and Nigeria at 61%. Access means a connection, not reliable power. Life expectancy rose from 68 to 78 years in China, 59 to 72 in India and 46 to 55 in Nigeria. In 1990 a Chinese person could expect to live 7 years less than an American; in 2024 the gap is 0.9 years.
| Country | Life expectancy 1990 | Life expectancy 2024 | Electricity access 2000 | Electricity access 2023 |
|---|---|---|---|---|
| China | 68.2 | 78.0 | 96.7% | 100.0% |
| India | 58.6 | 72.2 | 60.3% | 99.5% |
| Nigeria | 45.7 | 54.6 | 43.2% | 61.2% |
| United States | 75.2 | 78.9 |
Indicators SP.DYN.LE00.IN and EG.ELC.ACCS.ZS.
10. The bill: air
Mean exposure to fine particles (PM2.5) fell in China from 49 µg/m³ in 2010 to 32 in 2023. In India it went from 52 to 54, in Nigeria from 57 to 66 (including natural Saharan dust), in Germany from 16 to 9 and in the United States from 9 to 7. The WHO 2021 guideline for the annual mean is 5 µg/m³; none of these countries meets it. The values are modeled estimates from satellites and ground stations, not readings from any one city.
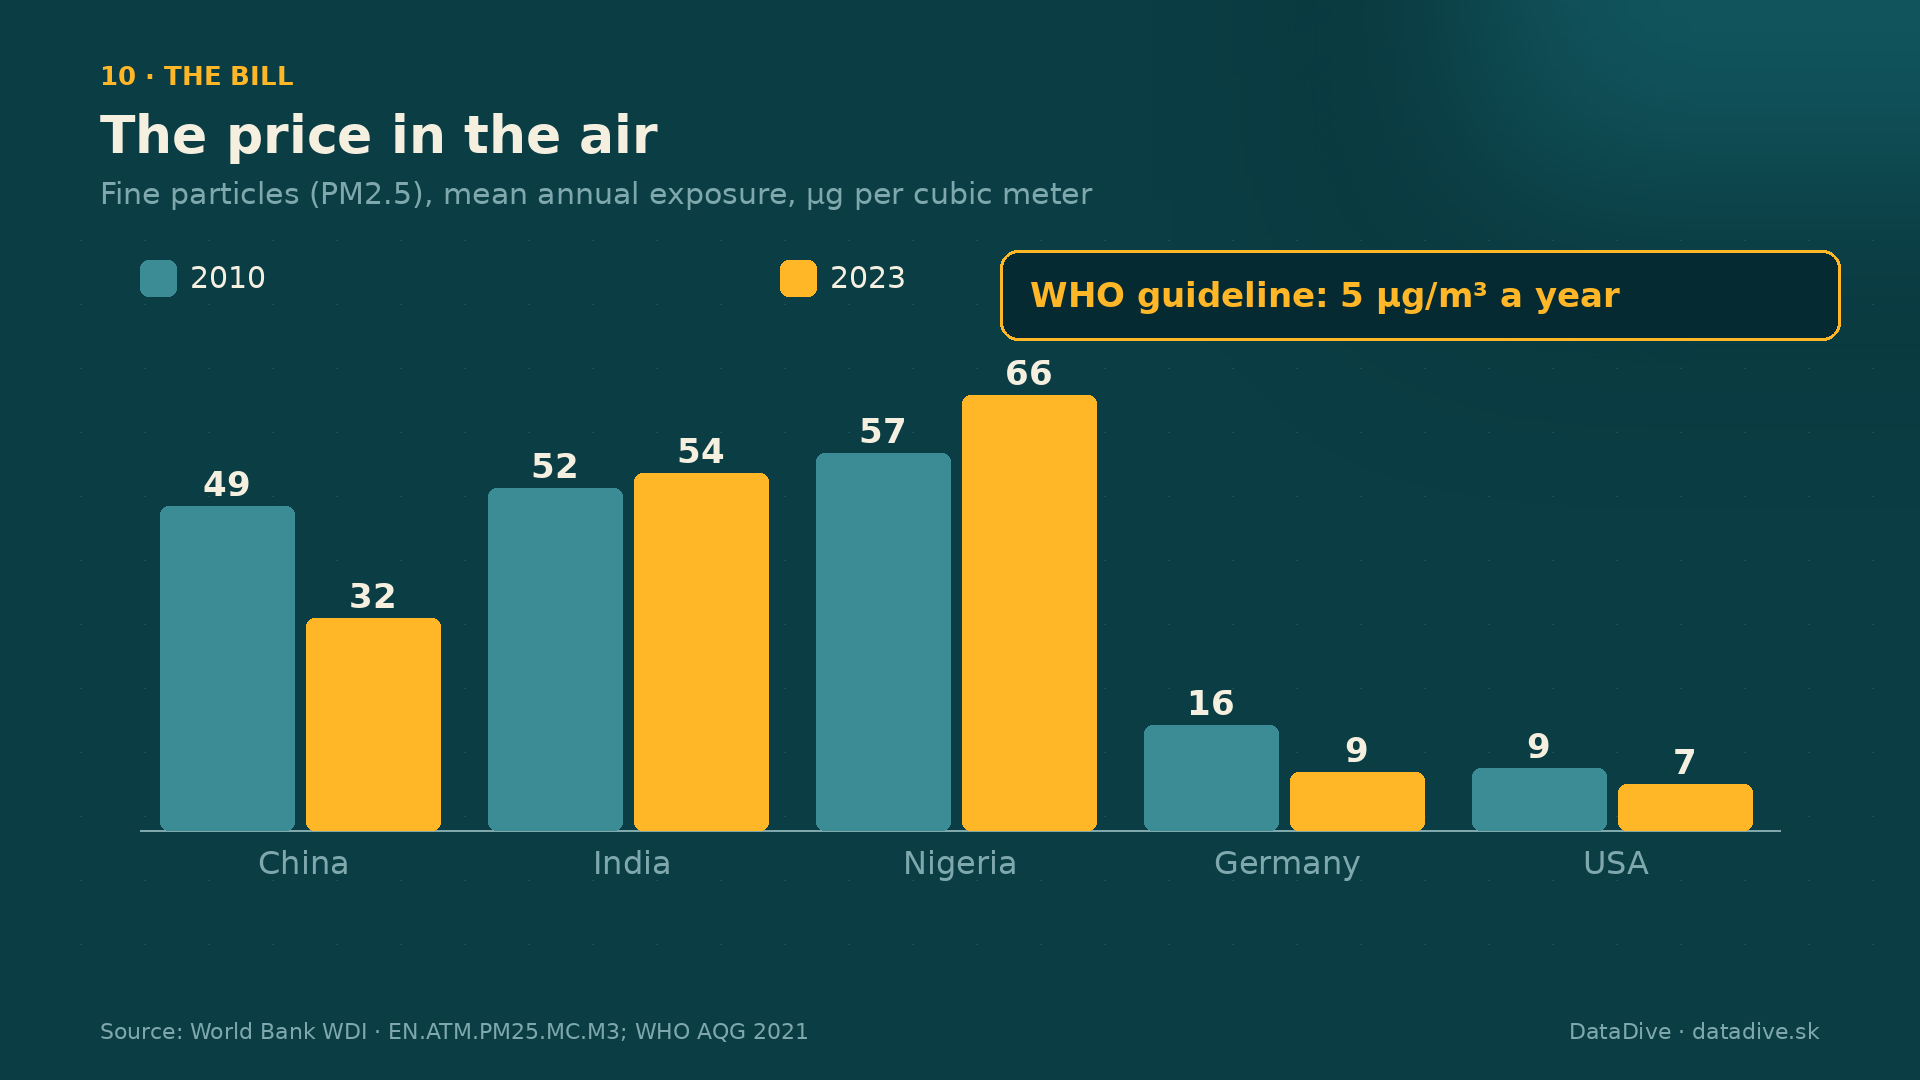
| Country | 2010 | 2023 | Change |
|---|---|---|---|
| China | 49.0 | 32.0 | -35% |
| India | 51.7 | 54.1 | +5% |
| Nigeria | 57.0 | 65.7 | +15% |
| Germany | 15.8 | 8.8 | -44% |
| United States | 9.3 | 7.0 | -25% |
Indicator EN.ATM.PM25.MC.M3, micrograms per cubic meter.
11. The people behind the averages
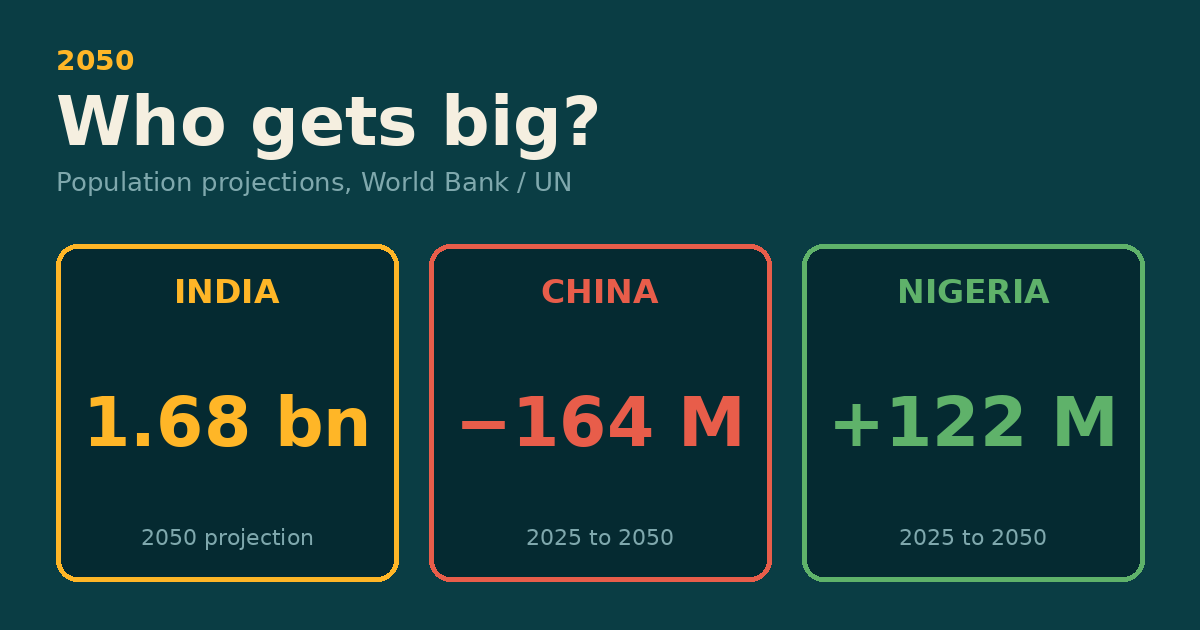
Since 1990 China's population grew 24% to 1.41 billion, India's 68% to 1.45 billion, and Nigeria's more than doubled, from 97 million to 233 million. Multiplying income per person by population gives a rough measure of the whole economy: it grew about 18 times in China, 7 times in India and 3.5 times in Nigeria (derived by us, not a World Bank figure). Nigeria's economy grew substantially; each Nigerian received only about half as much again. 41% of Nigerians are under 15, against 25% in India and 16% in China.
| Country | Population 1990 (M) | Population 2024 (M) | Total economy, change (derived) | Under 15, 2024 |
|---|---|---|---|---|
| China | 1,135 | 1,409 | ×17.8 | 16% |
| India | 865 | 1,451 | ×7.4 | 25% |
| Nigeria | 97 | 233 | ×3.5 | 41% |
Where is India now?
A useful comparison is when China looked like India does today. India's income per person ($9,416) matches China around 2009, its farm-job share (42%) matches China around 2007, and its urban share (35%) matches China around 2000. This is a similarity in numbers, not a forecast.
What the data cannot tell us
The numbers show what changed together: falling farm work, rising factory output and energy use, growing cities, longer lives and a visible cost in the air in China; the same direction, more slowly, in India; and in Nigeria, urbanization and population growth without a comparable rise in income per person. They do not show why. Policy, geography, history, trade, conflict and luck all play a part, and a chart cannot separate them. Several series are modeled, some are revised each year, and the latest values (2023 to 2025) may change.
Method and sources
| Indicator | Name |
|---|---|
| NY.GDP.PCAP.PP.KD | GDP per capita, PPP (constant 2021 international $) |
| SL.AGR.EMPL.ZS | Employment in agriculture (% of total employment) (modeled ILO estimate) |
| SP.URB.TOTL.IN.ZS | Urban population (% of total population) |
| EG.USE.PCAP.KG.OE | Energy use (kg of oil equivalent per capita) |
| AG.YLD.CREL.KG | Cereal yield (kg per hectare) |
| NV.IND.MANF.CD | Manufacturing, value added (current US$) |
| NE.GDI.TOTL.ZS | Gross capital formation (% of GDP) |
| EG.ELC.ACCS.ZS | Access to electricity (% of population) |
| SP.DYN.LE00.IN | Life expectancy at birth, total (years) |
| EN.ATM.PM25.MC.M3 | PM2.5 air pollution, mean annual exposure (micrograms per cubic meter) |
| SP.POP.TOTL | Population, total |
| SP.POP.0014.TO.ZS | Population ages 0-14 (% of total population) |
All values come from the World Bank Open Data API (World Development Indicators, CC BY 4.0), retrieved on 1 November 2026. PM2.5 guideline: WHO Global Air Quality Guidelines 2021. Derived figures (multiples, percent changes, the 'total economy' product and the 'China in year X' matches) are our calculations from those series.